Adaptive Immunity
1 collaborator
 Jeff Klemens (Author)
Tags
Tagged by Jeff Klemens over 7 years ago
Tagged by Jeff Klemens over 7 years ago
Tagged by Jeff Klemens over 7 years ago
Tagged by Jeff Klemens over 7 years ago
Tagged by Jeff Klemens over 7 years ago
 Download this model
Do you have questions or comments about this model? Ask them here! (You'll first need to log in.)
WHAT IS IT?
This model is designed to demonstrate the process by which adaptive immunity arises as a result of clonal selection. The model also includes functions for simulating the dynamics of vaccination and the loss of adaptive immunity provoked by measles infection. It is intended to be used as an active learning activity in a college or high-school biology course.
HOW IT WORKS
The model consists of five classes of agents: Lymphocytes, Antigens, Antibodies, Vaccine particles, and a Measles pathogen.
Lymphocytes
Lympohcytes in the model represent B-lymphocytes, and are depicted by circle turtle shapes.
- The diversity of lymphocyte colors included in the model corresponds to the diversity of B-lymphocte clones, or lymphocytes that bear the same antigen receptors, within the system. Each clone is represented by one of the 14
base-colorsin Netlogo. - Each time that setup is run, one color of lymphocytes is randomly selected to be the active color. The active color lymphocyte possesses antigen receptors specific to the antigen that will be introduced in this model run.
- Lymphocytes move randomly around the world, which represents a human body.
- Lymphocytes have equal birth and death rates. Births and deaths are calculated probabastically for each lymphocyte each tick, such that the population of each clone will exhibit stochastic variation (a random walk).
- There is a "rescue effect" in place for each lymphocyte color, so if one color goes extinct another lymphocytes of that color will be added to the world and a random lymphocyte will be killed to offset it.
- If the total population of lympohcytes falls below 235 the reproduction rate will temporarily be doubled until the lymphocyte total returns to 250.
Antigens
Antigens are any foreign body that causes an immune response. In this model they are assumed to be pathogenic organisms or viruses that are capable of reproducing. They are depicted by black monster turtle shapes.
- Antigens are introduced into the world by the ANTIGENS button. The number of antigens introduced is determined by the antigen-load slider.
- Antigens move randomly around the world.
- Antigens reproduce probabalistically each tick.
- Antigens only die when they come into contact with an antibody.
Antigen-Lymphocyte interactions
When an antigen and a lymphocyte of the active color occupy the same or adjacent patches in the model the lymphocyte becomes activated. Activated lympohcytes are depicted by the custom bold-circle turtle shape (same as a lymphocyte but with a bold black outline). Activated lymphocytes increase their reproduction rate by a factor determined by the user.
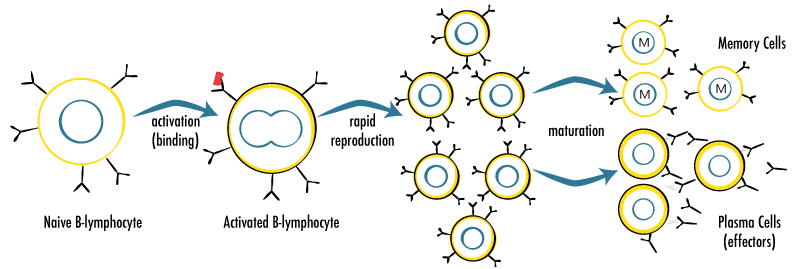
In the immune system, activated lymphocytes then further develop into two types of cells:
Memory lymphocytes are depicted with the custom
M-circleturtle shape, which is the same as lympocyte but bearing the letter "M". Memory lymphocytes are relatively long-lived cells. In the model their birth and death rates are set to an order of magnitude lower than those of typical lymphocytes.- Plasma cells (the effector cell of the B-lympohcyte) are short-lived. Plasma cells produce antibodies for the duration of their activiation, and then die.
- Plasma cells (the effector cell of the B-lympohcyte) are short-lived. Plasma cells produce antibodies for the duration of their activiation, and then die.
Antibodies
Antibodies are produced by activated lymphocytes.
- Antibodies move in a straight line in a random direction away from the activated lympohcyte.
- Antibodies live for a fixed time and then die.
- If an antibody and an antigen occupy the same space patch at any time, the antigen dies.
- Antibodies' effectiveness in clearing antigens can be adjusted with the antibody-effectiveness switch. In the high setting, antibodies travel 10 patches each tick and live for 8 ticks. In the low setting, antibodies travel 5 patches each tick and live for 4 ticks.
Vaccines
Vaccines function by stimulating a secondary immune response, often using killed or inactivated viral particles. Vaccine particles in the model are depicted by grey monster turtle shapes. Pushing the VACCINE button introduces a number of vaccine particles determined by the vaccine-load slider.
- Vaccine particles do not reproduce.
- Vaccine particles persist for 10 ticks and then die.
- Antibodies have no effect on vaccine particles.
- Vaccine particles do not count towards the values shown in the antigen plot.
- Lymphocytes respond to the vaccine particles in the same way as they respond to an antigen, producing activated lymphocytes, memory cells, and antibodies.
Measles
Measles has been demonstrated to cause long-term "immune memory loss" by depleting the overall lymphocyte population, including memory cells for non-measles diseases (Mina et al. 2015). The introduction of a measles vaccine has thus resulted in a drop in mortality rates that is larger than what can be explained by the drop in measles cases alone.
Pressing the MEASLES button causes the appearance of a large red monster turtle. This turtle does not interact with any of the other turtles in the model, but causes an immediate 95% drop in lymphocyte populations. This function is most useful to demonstrate what happens to the secondary immune response when measles intervenes between the primary and secondary response. It should be paired with a discussion of the results of Mina et al.'s (2015) study. I suggest showing students the data from Figure 1 of that paper or reading the news item about the study by Doucleff (2015).
HOW TO USE IT
The "setup" and "go/pause" buttons
setup clears all data and start a new simulation. Setup will create a population of 250 lymphocytes representing 14 different clones - lymphocytes that have the same antigen receptors. go/pause will begin the simulation. Without any other input, each lymphocyte population will undergo a random walk that will be different each time you run the model. Pressing the go/pause button during the simulation will pause the simulation. Other buttons are active at this time, so the user could, for example, pause the simulation, press the VACCINE button, and then restart the simulation from that point with the vaccine particles now introduced.
antibody-effectiveness
A switch that controls how effective antibodies are at clearing infections. In the low position, antibodies move 3 spaces per tick and last for 4 ticks before dying. In the high position, antibodies move 10 spaces per tick and last for 8 ticks. You should start with antibody-effectiveness in the low position, which is the default value.
antigen-load
A slider that determines the number of antigens that are added to the system each time the ANTIGENS button is pressed. The default value is 50.
vaccine-load
A slider that determines the number of vaccine particles that will be added to the system each time the VACCINE button is pressed. The default value is 200.
reproduction-multiplier-when-active
Lymphocytes have a default 15% probability of reproducing or dying each tick. When a lymphocyte is activated, the reproductive rate (but not the death rate) will be increased by a factor determined by this slider. Example: when this slider is set to 3.0, the default value, the reproductive rate will triple for the duration of activation.
ANTIGENS button
Pressing the ANTIGENS button at any point during the simulation introduces antigens to the system. The time at which the antigen infection occurs will be recorded in the Output Window. When the population of antigens has been reduced to 0 by the antibodies, the time will be recorded as the "clearance time" in the Output Window.
VACCINE button
Pressing the VACCINE button at any point during the simulation will introduce vaccine particles to the system. The time at which the vaccine is introduced will be recorded in the Output Window. Pressing the vaccine button when there is already a very large population of memory cells may lead to slow run times due to the very large number of antibodies that are likely to be generated.
MEASLES button
Pressing the MEASLES button will introduce a measles infection, which will cause 95% of the lympocytes in the simulation, selected randomly across all clones, to die immediately. A large red measles monster will appear for 5 ticks once the measles button is pressed; this turtle does not interact with any of the other agents in the simulation. The time at which the measles infection is introduced will be recorded in the Output Window.
THINGS TO NOTICE
Most biology textbooks demonstrate secondary immunity with something that looks like this:
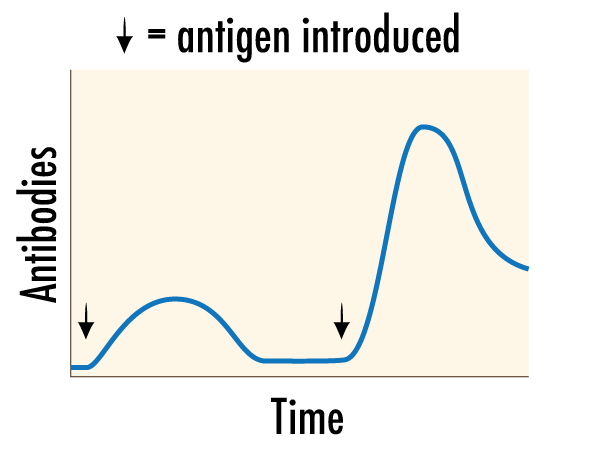
This graph is a static version of the Antibody Population graph that forms during this simulation. Can you recreate something that resembles this graph? From any of the line graphs in this model, you can obtain X and Y values at any point on the display by hovering over the graph with your cursor. Make sure to pay attention to the Y axes on all of these graphs, because the axis will vary dynamically within and between model runs.
Note that the timing of certain events (infection and clearance of an antigen, time of vaccination, time of measles infection) are recorded in the Output Window of the model. The difference between infection and clearance times for antigens can be used to compare the rapidity of primary and secondary immune responses.
LESSON PLAN
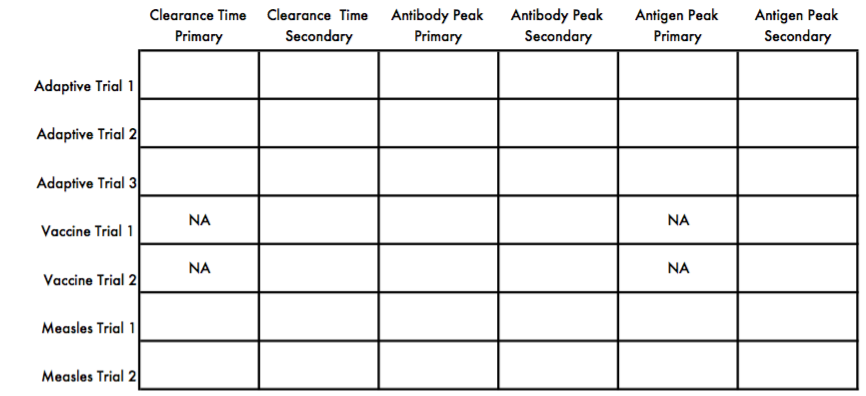
For using this model in the classroom, you might create a data table that looks something like this. The table can be drawn on a whiteboard if done as an instructor-guided demonstration or handed out as a worksheet for lab or activity use.
Before you start
Set the speed system slider to a rate that is slow enough to observe the dynamics of lymphocyte activation and the production of antibodies and memory cells. Somewhere around 200 ticks per minute is about right.
In order to understand the stochastic dynamics of the lymphocytes in the model, press setup and go/pause, but don't push any other buttons.
Study question:
- Why do the populations of lymphocytes fluctuate if all clones have the same birth and death rates?
Adaptive Immunity
Press setup, press ANTIGENS and then press go/pause. Press go/pause again to pause the model once the infection has cleared. As the model is running identify antigens, activated lymphocytes, antibodies, and memory cells.
While the model is paused, review the data displayed in the three graphs and in the output window.
Record on the data sheet the duration of the antigen infection under "Clearance Time Primary" in the row "Adaptive Trial 1."
Measure the peak of the antigen and antibody populations on their respective graphs by hovering over the line graph with your cursor. Record these numbers under "Antibody Peak Primary" and "Antigen Peak Primary" in the row "Adaptive Trial 1."
Press the ANTIGENS button, and then press go/pause to restart the model. Wait until the secondary infection clears, and then press go/pause again to pause.
On the same row of the data sheet, record the duration of the secondary infection and the antibody and antigen peak levels as you did before, recording the data in their respective "Secondary" columns.
Go back to step 1 and repeat this procedure at least two more times, recording the data on subsequent lines of the data sheet.
Study questions:
- Which lymphocyte color has receptors that match this antigen in each model run?
- Are antigen specific receptors present before or only after the antigen is introduced?
- When are memory cells produced?
- Describe the antibody graph in terms of the strength of the immune response.
- Describe the antigen graph in terms of the infection intensity.
- Based on your data, what differences do we observe between the primary and secondary immune responses?
Vaccines
Press setup, press VACCINE and then press go/pause. Press go/pause again to pause the model once the vaccine particles have cleared. As the model is running identify the vaccine particles and note that they do not reproduce like the antigens did.
Measure the peak level of antibodies produced and record it in the row "Vaccine Trial 1" on your datasheet. Note that we are not recording antigen level or the duration of infection. (No live antigens exist and vaccine particle duration is a fixed quality of the model).
Press the ANTIGENS button, and then press go/pause to restart the model. Wait until the antigen infection clears, and then press go/pause again to pause.
On the same row of the data sheet, record the duration of the infection and the antibody and antigen peak levels as you did before, recording the data in their respective "Secondary" columns.
- Go back to step 1 and repeat this procedure at least one more time, recording the data on subsequent lines of the data sheet.
Study questions:
- We recorded the response to the antigens in the secondary infection columns. Why? Is this best considered a secondary or primary infection?
- Compare your data to the adaptive immunity trials. What is different in the relationship of the two antibody peaks with and without the vaccine? To what can this difference be attributed?
- How do duration and antigen level of the post-vaccination infections compare to the data you recorded for the adaptive trials?
Measles
Press setup, press ANTIGENS and then press go/pause. Press go/pause again to pause the model once the infection has cleared.
While the model is paused, record the data for "Clearance Time Primary," "Antibody Peak Primary," and "Antigen Peak Primary" in the row "Measles Trial 1."
Press the MEASLES button. Observe the drop in lymphocyte populations and review the information from Mina et al. 2015.
Press go/pause to allow the model to move forward. Press go/pause again to pause the model once the red measles turtle has disappeared and the lymphocyte populations have recovered.
Press the ANTIGENS button, and then press go/pause to restart the model. Wait until the secondary infection clears, and then press go/pause again to pause.
On the same row of the data sheet, record the duration of the secondary infection and the antibody and antigen peak levels as you did before, recording the data in their respective "Secondary" columns.
Go back to step 1 and repeat this procedure at least one more time, recording the data on subsequent lines of the data sheet.
Study questions:
- What is the relationship between the primary and secondary response when measles intervenes?
- What are some potential medical implications of your answer to the previous question?
Advanced
What immune system characteristic drives the secondary response? Try adjusting the antibody-effectiveness from low to high. Now try to generate a secondary immune response by adding antigens twice. How does having more potent antibodies affect the dynamic of the model?
Now adjust the reproduction-multiplier-when-active slider. Try to generate a secondary response at lower and higher multipliers. How does this affect the dynamics of adaptive immunity? Can you generate an adaptive immune response if the multiplier is set to 1?
Reduce the vaccine-load slider and compare the secondary response to those you recorded on your datasheet using the default settings. What happens to your ability to generate a secondary immune response with the model as that number decreases? What happens as you increase the vaccine load? Can you explain this result in terms of lymphocyte populations?
EXTENDING THE MODEL
A curve smoothing function for the plots might help students compare the graphs generated with conceptual versions presented in textbooks. On the other hand, the stochastic nature of the model is perhaps best represented by the unsmoothed line.
The model does not include many details of the immune system that might be taught in a general biology class, including the distinction between IgG and IgM antibodies, the role of helper T-cells and macrophages, or other phenomena which could potentially be modelled in Netlogo. This was intentional to keep the model focused on the process of clonal selection, which Klemens identified as a particularly difficult conceptual hurdle for his students over the years.
No attempt has been made to translate values for antibody populations, antigen and vaccine loads, or the time scale of the model into biologically meaningful parameters. Translating to meaningful units may better prepare students for future work.
CREDITS AND REFERENCES
Madeline Conway drew the figures included in this Info document.
References
Doucleff, M. (2015, May 7). Scientists Crack A 50-Year-Old Mystery About The Measles Vaccine. Retrieved August 3, 2017, from http://www.npr.org/sections/goatsandsoda/2015/05/07/404963436/scientists-crack-a-50-year-old-mystery-about-the-measles-vaccine
Mina, M. J., Metcalf, C. J. E., Swart, R. L. de, Osterhaus, A. D. M. E., & Grenfell, B. T. (2015). Long-term measles-induced immunomodulation increases overall childhood infectious disease mortality. Science, 348(6235), 694–699. https://doi.org/10.1126/science.aaa3662
HOW TO CITE
Adaptive Immunity 1.0 Created by Sarah Gift and Jeffrey A. Klemens
If you mention this model or the NetLogo software in a publication, we ask that you include the citations below.
For the model itself:
- Gift, S. and J.A. Klemens. (2017). Netlogo Adaptive Immunity Model 1.0. https://github.com/klemensj/Immune.
Please cite the NetLogo software as:
- Wilensky, U. (1999). NetLogo. http://ccl.northwestern.edu/netlogo/. Center for Connected Learning and Computer-Based Modeling, Northwestern University, Evanston, IL.
COPYRIGHT AND LICENSE
 This work is licensed under a Creative Commons Attribution-NonCommercial-ShareAlike 4.0 International License.
Comments and Questions
globals [death-rate reg-repro antibody-movement infected active-color]
     ; death-rate = chance of the turtle dying
     ; antibody-movement = how many spaces the antibody has moved
     ; reg-repro = the chance a lymphocyte will reproduce when it is not active or a memory cell
     ; infected = records whether antigens have been inputted
     ; active-color = the color of the lymphocyte that responds to the antigen
breed [lymphocytes lymphocyte]  ; creating a set of lymphocytes
breed [antigens antigen]        ; creating a set of antigens
breed [antibodies antibody]     ; creating a set of antibodies
breed [measles measle]          ; creating special measles antigen
breed [vaccines vaccine]        ; creating special vaccine antigen
lymphocytes-own [active active-time reproduction-rate memory]
     ; active = whether the cell is active ( 0 is no ; 1 is yes )
     ; active-time = how much time left the cell has to be active
     ; reproduction-rate = how fast the cell reproduces
     ; memory = records whether the lymphocyte is a memory cell (0 is no ; 1 is yes)
antibodies-own [energy]
     ; energy = how many ticks the antibody has left to live
measles-own [measles-duration]
vaccines-own [vaccine-duration]
     ; vaccine-duration = for how many ticks will the vaccines persist in the system

to setup
  clear-all
  clear-output
  ask patches [set pcolor white]
  set infected 0      ; at setup, the system is not infected with any antigens
  set death-rate 15   ; values fit to give best response, no inherent meaning to these rates
  set reg-repro 15
  set active-color one-of base-colors        ;set active color to a random lymphocyte color
  set-default-shape lymphocytes "circle"     ; lymphocytes are circles
  set-default-shape antigens "monster"       ; antigens are monsters
  set-default-shape measles "monster"        ; measles are monsters, big red ones
  set-default-shape vaccines "monster"       ; vaccines are greyed-out monsters
  set-default-shape antibodies "Y"           ; antibodies are Y-shaped
  create-lymphocytes 250  ; create the lymphocytes, then initialize their variables
  [
    set color one-of base-colors
    set active 0 ; all lymphocytes are initially inactive
    set active-time -1
    set reproduction-rate reg-repro ; all lymphocytes are initially inactive, so reproduce at regular rate
    set size 1.5  ; easier to see
    set label-color blue - 2
    setxy random-xcor random-ycor
    set memory 0
  ]
  reset-ticks
end

to go
  if not any? turtles [ stop ]
  replace-extinct
  ask antigens[
    move
    antigen-reproduce
  ]
  ask lymphocytes [
    bind
    activated
    move
    reproduce
    lymph-death
  ]
  ask antibodies [
    antibody-move
    set energy energy - 1
    antibody-death
  ]
  measles-death
  vaccine-death
  antigen-extinct
  tick
end

to replace-extinct           ; this is a "rescue effect", if any lymphocyte types (colors) go extinct we add one more to the population
  let counter 5
  while [counter < 140]      ; check all the colors
  [
    if count lymphocytes with [color = counter] = 0
  [
      create-lymphocytes 1  ; create the replacement lymphocyte, then initialize its variables
      [
        set color counter
        set active-time -1
        set active 0
        set reproduction-rate reg-repro
        set size 1.5
        set label-color blue - 2
        setxy random-xcor random-ycor
        ask n-of 1 lymphocytes [ die ]   ; kill a random lympohcyte to make up for the replacement
      ]
  ]
  set counter counter + 10
]
end

to move  ; antigen and lymphocyte procedure
  rt random 50
  lt random 50
  fd 1
end

to antigen-reproduce
   if random 100 < 20 and color != grey   ;; and statement keeps grey "vaccine antigens" from reproducing
    [
      hatch 1 [ rt random 360 fd 1]
    ]
end

to bind                                          ; active-color lymphocytes are activated by the antigen
 if color = active-color[
   if (one-of antigens in-radius 1 != nobody) or (one-of vaccines in-radius 1 != nobody)
   [
     set active 1
     set active-time 10   ;; length of typical cell lifespan if death rate is 10
   ]
  ]
end

to activated
  if active-time = 0                                 ; kills activated after time is up
    [
       die
      ]

  if active = 1
  [
    set reproduction-rate (reproduction-multiplier-when-active * reg-repro) ; start rapid reproduction
    set size 2               ; increase size
    set shape "bold-circle"  ; outline circle
    hatch-antibodies 2       ; create antibodies
    [
      set color black
      rt random-float 360 fd 1  ; randomly pick a direction and move forward
      if antibody-effectiveness = "high"
      [
          set energy 8
      ]

      if antibody-effectiveness = "low"
      [
        set energy 4 ; for antibodies, energy tracks how many ticks the antibodies have left to live
      ]
    ]
   set active-time active-time - 1    ;; counts back down to inactivity
  ]
end

to reproduce  ; determine if the lymphocyte reproduces

 if random 100 < reproduction-rate
  [ ifelse memory = 1
    [
      hatch 1 [
        set shape "M-circle"
        rt random-float 360 fd 1]
    ]
    [
       ifelse active = 1 ; if active, produce both a memory cell and an active cell ; else, produce regular cell
        [
                  hatch-lymphocytes 1 [ set shape "M-circle"
                  set color active-color
                  set active 0
                  set reproduction-rate 2
                  set size 2.5  ; easier to see
                  set label-color blue - 2
                  set memory 1
                  rt random-float 360 fd 1 ]

                  hatch 1 [ rt random-float 360 fd 1]
        ]
        [
            ifelse count lymphocytes < 235
               [
                        hatch 2 [ rt random-float 360 fd 1]
               ]
                [
                        hatch 1 [ rt random-float 360 fd 1]
                 ]
        ]
    ]
  ]
end

to lymph-death  ; determine if the lymphocyte dies
  if memory = 0 and random 100 < death-rate
      [
        die
      ]
  if memory = 1 and random 100 < 2
  [
    die
  ]
end

to antibody-move  ; the speed (distance moved each time step) ends up being a measure of potency of each activated cell
  set antibody-movement 0
  if antibody-effectiveness = "high"
  [
     while [antibody-movement < 10]
     [fd 1
     kill-antigen  ; check to see if it is on the same spot as an antigen and if so, kill it
     set antibody-movement antibody-movement + 1
     ]
  ]

  if antibody-effectiveness = "low"
  [
     while [antibody-movement < 5]
     [fd 1
     kill-antigen
     set antibody-movement antibody-movement + 1
     ]
  ]
end

to antibody-death
  if energy < 1
  [ die ]
end

to kill-antigen
  let prey one-of antigens-here
  if prey != nobody
  [ask prey[die]]
end

to measles-death
  ask measles
  [
    if measles-duration < 1
     [  die  ]
     set measles-duration measles-duration - 1
  ]
end

to vaccine-death
  ask vaccines
  [
    move
    if vaccine-duration < 1 [die]
    set vaccine-duration vaccine-duration - 1
  ]
end

to antigen-extinct
  if (count antigens = 0) and (infected = 1)
  [
     output-type "antigen clearance time "  output-print ticks
    set infected 0
  ]
end

to insert-antigens                               ; create an infection every button push
  output-type "antigen infection time "  output-print ticks
  set infected 1 ; noting that antigens have been put into the cell
    create-antigens antigen-load
    [
     set color black
     set size 2  ; easier to see
     set label-color blue - 2
     setxy random-xcor random-ycor
    ]
end

to infect-measles
  output-type "measles infection time "  output-print ticks
   create-measles 1
    [
     set color red
     set size 50
     set label-color blue - 2
     setxy 0 0
     set measles-duration 5
    ]

  ask lymphocytes
      [
        if random 100 < 95
        [ die ]
      ]
end

to insert-vaccine
  output-type "vaccine injection time "  output-print ticks
  create-vaccines vaccine-load
    [
     set color grey
     set size 2  ; easier to see
     set label-color blue - 2
     setxy random-xcor random-ycor
     set vaccine-duration 10
    ]
end
There is only one version of this model, created over 7 years ago by Jeff Klemens.
Attached files
| File | Type | Description | Last updated | |
|---|---|---|---|---|
| Adaptive Immunity.png | preview | Preview for 'Adaptive Immunity' | over 7 years ago, by Jeff Klemens | Download |
| LESSON_PLAN 13 July 2018.pdf | Lesson plan for using the model in a classroom setting | over 7 years ago, by Jeff Klemens | Download |
This model does not have any ancestors.
This model does not have any descendants.